
I’m an automation test engineer with many years of experience across both the public and private sectors. I’ve built automation frameworks from scratch and integrated them into CI/CD pipelines, and I’ve lived the usual conversations first-hand: what’s our test coverage?, why are all these tests failing?, why can’t you just add this assertion to the framework?, and so on.
In the age of agentic AI, teams adopting AI and LLMs into their test automation should look beyond prompting — “generate these test cases,” “fix this failing test,” “the element wasn’t found.” There’s a deeper technique worth adopting: knowledge graphs. I’ve been learning how to bring graph thinking into a test suite, and it has genuinely changed how I see my own tests. To make it concrete, I built a small todo-list app with unit and end-to-end tests using pytest and Playwright: 👉 https://github.com/Beakonhub/todo-list
This post walks through what I learned, using testing vocabulary throughout so the concept never gets lost in theory.
Learning knowledge graphs
I won’t rehash the definition or history of graphs — Google, YouTube and modern LLMs all lean on them, and there’s plenty online. For a QA engineer, the useful framing is this:
A node is an entity. In our world that’s a:
- Test
- Page object
- Fixture
- Driver
- API endpoint
An edge is a relationship between two nodes — and this is the part I got wrong at first. An edge is not an action; it’s the link that connects two entities. For example, a LoginTest (a node) calls page.goto() (another node), and the relationship between them is the edge:
LoginTest —CALLS→ goto
That little arrow is how you model a graph.
Two kinds of edge: directed and undirected
Directed edge — a one-way relationship between two nodes. LoginTest depends on goto(): LoginTest —DEPENDS_ON→ goto, and not the other way round. Undirected edge — a symmetric relationship with no direction, e.g. “these two tests are similar.”
Directedness matters enormously, because dependency is directional, and dependency is what drives impact analysis.
Path
A path is a sequence of edges you can walk, e.g. LoginTest → goto → auth-service. The conventional way of deciding what to test relies on tribal knowledge or just running everything (full regression). A graph turns that guess into a query.
Cycle
A cycle is a path that loops back to where it started: TestA → TestB → TestC → TestA. When this shows up in a test suite, the dependency graph is telling you something — usually an order-dependent or flaky test. A cycle is a smell.
DAG
A DAG (Directed Acyclic Graph) is a directed graph with no cycles — think of a healthy build pipeline. “Is my suite a DAG?” is quietly a useful health check.
Degree
Degree is how many edges touch a node — for example, how many tests in the suite call page.goto(). High degree means “if this breaks, a lot breaks.”
Three classic algorithms, three testing jobs
- Traversal (BFS/DFS) — “What can I reach from here?” → impact analysis / test selection.
- Shortest path — “What’s the closest link between these two nodes?” → tracing how a test connects to a component.
- Centrality — “Which node is most important?” → risk ranking. goto, for instance, is a high-centrality chokepoint: if it breaks, many tests fail. A smoke pack should be built from high-centrality nodes — this is what I call risk coverage over test coverage.
What the graph actually told me
I extracted my todo app’s tests and the functions they call into a graph, then ran the centrality algorithms with networkx. Here’s the real output — and it surprised me in two useful ways.
Most-called functions (degree):
| Rank | Function | Degree |
|---|---|---|
| 1 | goto | 16 |
| 2 | to_be_visible | 14 |
| 3 | get | 13 |
| 4 | post | 13 |
| 5 | json | 12 |
The load-bearing nodes are the framework primitives every test leans on: navigation (goto), the most common assertion (to_be_visible), the HTTP calls (get/post), and response parsing (json). If goto breaks, 16 tests go with it — so it belongs in any smoke pack.
Surprise 1 — betweenness was all zeros. I expected betweenness (the “chokepoint on a path” measure) to be revealing, but every score came back 0.0. That’s not a bug — it’s my graph’s shape talking. My graph is two layers, Test → Function, with no Function → Function chains, so no node ever sits between two others. Lesson: a metric is only as meaningful as the shape of your graph. Betweenness needs chains; a star has none.
Surprise 2 — degree and PageRank disagree. PageRank (importance weighted by who points at you) ranked get first, and goto didn’t even make the top five. Degree counts how many callers; PageRank weights by which callers. The takeaway: my API tests carry more weighted importance than my navigation calls — a subtlety a plain count would hide.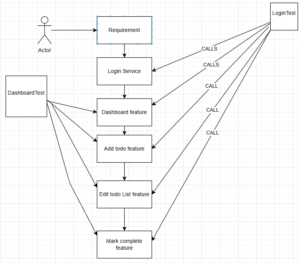
The diagram above shows how LoginTest and DashboardTest call into the app’s services, with goto as a high-centrality hub. Next, let’s model this properly in Neo4j.
Neo4j and Cypher
Neo4j is a graph database, and Cypher is the language you use to write node/edge relationships. For example, (LoginTest) —CALLS→ (LoginService) becomes:
(t:Test)-[:CALLS]->(s:Service)
Three things to remember:
- Nodes go in ()
- Relationships go in []
- The arrow –> is the link
Cypher is called “ASCII-art pattern matching” because you literally draw the shape you’re looking for and the database finds every place that shape exists.
The property graph model
Every node has two things:
    - A label — the node's type, written with a colon: :Test, :Service, :Fixture ("is a").
    - Properties — data the node carries, e.g. for a test case: *id: TC-001, name: Successful login, priority: HIGH, type: Smoke.*
Reading a full node:
( t : Test { name: ‘LoginTest’ } )
│ │ │ │
│ │ │ └─ property VALUE
│ │ └─ property KEY
│ └─ LABEL (the type: it’s a Test)
└─ variable/alias (so you can refer to it later, e.g. RETURN t)
the ( ) as a whole = a NODE
So (t:Test {name: 'LoginTest', suite: 'auth'}) is a node, labelled Test, named LoginTest, in the auth suite. Relationships can carry properties too: -[:CALLS {count: 12}]->.Buildin the todo app graph with Cypher
// Services (the app under test)
MERGE (auth:Service {name: ‘LoginService’})
MERGE (add:Service {name: ‘AddTodoService’})
MERGE (dashboard:Service {name: ‘DashboardService’})
MERGE (edit:Service {name: ‘EditTodoService’})
MERGE (com:Service {name: ‘MarkCompletedService’})
// Features that require the authentication service
MERGE (add)-[:REQUIRES]->(auth)
MERGE (edit)-[:REQUIRES]->(auth)
MERGE (com)-[:REQUIRES]->(auth)
// Test cases that call the app under test
MERGE (:Test {name: ‘LoginTest’})-[:CALLS]->(auth)
MERGE (:Test {name: ‘AddTodoTest’})-[:CALLS]->(dashboard)
MERGE (:Test {name: ‘EditTodoTest’})-[:CALLS]->(dashboard)
MERGE (:Test {name: ‘MarkCompletedTest’})-[:CALLS]->(dashboard)
Two things worth naming:
- MERGE is idempotent: it creates a node once, and if it already exists it matches the existing one instead of creating a duplicate. It’s the same discipline as a rerunnable test fixture — run it twice and you don’t end up with two test users.
- REQUIRES here models “authentication must happen before this action.”
Querying with MATCH
MATCH finds a pattern. This returns every test and the service it calls:
MATCH (t:Test)-[:CALLS]->(s:Service)
RETURN t.name, s.name
Add WHERE to filter:
MATCH (t:Test)-[:CALLS]->(s:Service)
WHERE s.name = ‘AddTodoService’
RETURN t.name, s.name
Why a graph beats SQL here
In SQL you’d chain JOINs across multiple tables — test → service → dependencies — which gets harder to read with every hop. In Cypher, an extra hop is just a longer arrow:
MATCH (t:Test)-[:CALLS]->(:Service)-[:REQUIRES]->(auth:Service {name: ‘LoginService’})
RETURN DISTINCT t.name
That’s “which tests are affected if authentication changes?” — readable, no tangle of JOINs. That readability-per-hop is the whole reason graph databases exist.
Where this is going
This is the foundation. From here the interesting direction is a proper knowledge graph of the system under test — requirements, features, tests, defects and the relationships between them — so questions like “which requirements have no tests?” and “what should I re-run if this component changes?” become queries instead of guesses.
For me, the shift in mindset is the real takeaway: stop measuring test coverage (how much ran) and start measuring risk coverage (did we cover what actually matters). A graph gives you the weights — centrality tells you what’s load-bearing, reachability tells you what a change touches — so you test what’s important, not just what’s numerous.
If you’re a QA engineer curious about where AI is taking testing, graphs are a genuinely underexplored corner. I’ll be writing more as I go.
The code and tests are here: https://github.com/Beakonhub/qa-graph-lab/tree/master